


Bitcoin 50-week SMA has become a key focus for traders after Bitcoin recently reclaimed the long-term technical indicator following 45 weeks below it.
Bitcoin has made a notable recovery in recent weeks, with the cryptocurrency moving back above the $86,000 level after a period of significant weakness.
The latest recovery has attracted attention not only because of the magnitude of the price move, but also because Bitcoin has crossed an important long-term technical indicator.
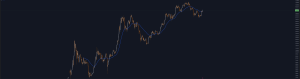
Bitcoin recently recorded its first weekly close above the 50-week simple moving average (SMA) in 45 weeks. The weekly close on September 20 came in at approximately $81,159, while the 50-week SMA stood near $78,788, according to market data cited by TradingView. FXStreet
That move places Bitcoin above a technical level that has played an important role during previous market cycles.
However, the significance of the breakout goes beyond simply moving above a moving average. The more important question is whether Bitcoin can remain above the 50-week SMA and turn the former resistance level into sustainable support.
Why the 50-Week SMA Matters for Bitcoin
The simple moving average is one of the most widely used technical indicators in financial markets.
A 50-week SMA calculates the average closing price of an asset over its previous 50 weekly periods. Because each observation represents an entire week, the indicator moves much more slowly than shorter-term moving averages.
For Bitcoin, this makes the 50-week SMA particularly useful when analyzing the broader market structure.
Shorter-term indicators such as the 20-day or 50-day moving average can respond quickly to changes in price. That can be useful when analyzing short-term momentum, but it can also produce more frequent false signals because Bitcoin regularly experiences large daily price swings.
The 50-week SMA filters much of that short-term volatility.
As a result, a weekly close above or below the indicator can provide a different type of information. Rather than focusing on what Bitcoin is doing over the next few hours or days, the indicator helps traders evaluate whether the longer-term market trend is changing.
This is particularly important after an extended period in which Bitcoin has remained below the moving average.
Bitcoin Has Finally Reclaimed a Long-Term Trend Indicator
The latest weekly close above the 50-week SMA ended a period of approximately 45 weeks during which Bitcoin remained below this long-term reference level.
Bitcoin’s weekly close around $81,159 was roughly 3% above the 50-week SMA near $78,788. The previous weekly close above the indicator occurred on November 9, 2025. FXStreet
The move therefore represents more than a short-term intraday breakout.
A weekly close means that Bitcoin maintained its position above the moving average through the entire weekly trading period. That distinction is important because temporary moves above a technical level can quickly reverse, particularly in a market as volatile as cryptocurrency.
The recent price action has also extended beyond the initial breakout. Bitcoin subsequently moved above $86,000, reaching an eight-month high according to recent market reports. MarketWatch
This has increased the distance between the current market price and the 50-week SMA.
But the distance itself is not necessarily the most important factor.
The next stage of the move will depend more heavily on whether Bitcoin can maintain its position above the long-term average during future pullbacks.
What Historical Bitcoin Cycles Tell Us
The 50-week SMA has frequently been monitored during Bitcoin’s major market cycles.
During prolonged periods of weakness, Bitcoin can trade below the moving average for an extended period. In some cases, attempts to recover above the indicator fail, leaving the moving average acting as resistance.
The opposite can also occur.
When Bitcoin successfully reclaims the 50-week SMA after a prolonged decline, the move can coincide with a transition from a bearish market structure toward a recovery phase.
Galaxy Research has examined historical Bitcoin bear-market periods and identified 13 weekly moves back above the 50-week moving average. Bitcoin avoided establishing a new cycle low in 11 of those 13 cases. CoinDesk
That historical relationship is worth noting, but it should not be interpreted as a guarantee.
Two of the historical instances were followed by additional declines, demonstrating that a reclaim of the moving average can also produce a false signal.
This distinction is particularly important when analyzing Bitcoin because moving averages are lagging indicators. They describe what price has already done rather than predicting with certainty what price will do next.
Bitcoin’s Previous Reclaims Provide Important Context
Bitcoin has experienced several important recoveries above the 50-week SMA during previous market cycles.
One notable example occurred in 2019 following the 2018 bear market. Bitcoin recovered above the long-term moving average around the $5,800 area in May 2019 and subsequently accelerated higher.
Another major example occurred following the COVID-19 market crash.
Bitcoin reclaimed the 50-week SMA around $9,000 in May 2020. Over the following months, the cryptocurrency entered a much larger advance and eventually reached approximately $64,000 in 2021.
The 2023 recovery provides another useful comparison.
Bitcoin moved back above the 50-week SMA around $28,000 in March 2023. The subsequent market advance eventually carried Bitcoin substantially higher, with the cryptocurrency reaching approximately $126,000 by October 2025.
These historical examples illustrate why traders continue to monitor the indicator.
However, they should not be interpreted as a direct template for the current market.
Every Bitcoin cycle develops under different monetary, liquidity, regulatory and market conditions. A technical pattern that occurred during one cycle does not necessarily produce the same result in another.
The 2021-2022 Cycle Shows the Risk of a False Breakout
The historical record also contains examples in which Bitcoin reclaimed the 50-week SMA but failed to establish a lasting recovery.
During the 2021-2022 bear market, Bitcoin moved above the 50-week moving average in December 2021 and again in March 2022.
Neither recovery resulted in a sustained change in the broader trend.
Bitcoin subsequently entered a deeper decline and eventually traded near $16,000.
This is one of the clearest reasons why the latest breakout should be monitored over time rather than interpreted from a single weekly candle.
A moving average reclaim can provide evidence that market structure is changing, but confirmation generally requires additional price action.
The behavior of Bitcoin during future pullbacks may therefore be more informative than the initial breakout itself.
Can the 50-Week SMA Become Support?
This is arguably the most important technical question facing Bitcoin after the recent move.
Before the breakout, the 50-week SMA was functioning as a significant resistance level. Bitcoin had spent months below it, making a sustained move above the indicator difficult.
Now that Bitcoin has moved above the average, the market will be watching whether the same level can begin functioning as support.
In practical terms, a future pullback toward the 50-week SMA could provide important information.
If Bitcoin approaches the moving average and buyers consistently defend the level, the market structure would look different from the previous environment in which rallies were repeatedly rejected around the indicator.
On the other hand, if Bitcoin quickly falls back below the 50-week SMA and begins recording repeated weekly closes underneath it, the recent breakout would carry less technical significance.
This is why the level around the 50-week SMA may remain important even if Bitcoin continues trading substantially above it.
Bitcoin’s Recovery Is Larger Than the Moving Average Breakout
The technical breakout should also be considered within the context of Bitcoin’s broader recovery.
Bitcoin has recovered significantly from the lows recorded earlier in the summer. Recent reports have placed the cryptocurrency’s rebound at roughly 40% from those lows, while the latest move above $86,000 marked an eight-month high. CoinDesk
The recovery has also occurred alongside strong activity in other risk-sensitive areas of financial markets.
Recent reporting has pointed to factors including institutional flows, short covering and broader changes in risk sentiment as contributors to Bitcoin’s latest advance. The Wall Street Journal
This matters because the 50-week SMA is only one component of Bitcoin’s market structure.
Price, trading volume, liquidity, derivatives positioning, ETF flows and broader macroeconomic conditions can all influence whether a technical breakout develops into a longer-lasting trend.
For this reason, the moving average should be viewed as a framework rather than an isolated trading signal.
What Bitcoin Traders Should Watch Next
With Bitcoin now trading above the 50-week SMA, several technical developments could become increasingly important.
The first is the behavior of price around the moving average.
A successful retest of the area around $78,000-$79,000 could provide additional information about whether the previous resistance has become support. By contrast, a rapid breakdown below that region would raise questions about the durability of the recent breakout.
The second factor is the sequence of weekly closes.
One weekly close above the 50-week SMA is significant, but consecutive weekly closes above the indicator would provide additional confirmation that the market is behaving differently from the previous bearish phase.
The third factor is Bitcoin’s broader market structure.
A sustained series of higher highs and higher lows would provide a different technical picture from a market that simply experiences a sharp recovery before returning below its long-term trend line.
This is particularly relevant because moving averages are inherently backward-looking.
They can help traders identify changes that have already begun to occur, but they cannot independently determine the next Bitcoin price target or guarantee the direction of the next move.
The Bottom Line for Bitcoin’s Market Structure
Bitcoin’s recovery above the 50-week SMA represents an important development in the cryptocurrency’s longer-term technical structure.
The latest weekly close near $81,159 occurred above the approximately $78,788 50-week moving average, marking the first weekly close above the indicator in 45 weeks. Bitcoin subsequently extended its recovery and moved above $86,000. Investing.com
Historical data shows that previous Bitcoin reclaims of the 50-week moving average have often occurred around important transitions in market cycles. At the same time, history also shows that false breakouts can occur.
That makes the next phase particularly important.
The key question is no longer simply whether Bitcoin can break above the 50-week SMA. It is whether the cryptocurrency can maintain that position and establish the former resistance as lasting support.
If that happens, the 50-week SMA could become an increasingly important reference point for evaluating Bitcoin’s longer-term market structure.
If Bitcoin instead falls back below the indicator and remains there, the significance of the recent reclaim would be reduced.
For now, the 50-week SMA provides a clear technical level to watch as Bitcoin moves through the next stage of its market cycle.